Let’s begin by going over basic concepts and terms.
Spectra: A statistical distribution of the probability that any photon will emit at a specific wavelength. Spectra that you see on a typical spectra viewer are typically both the excitation and emission profiles of a fluorophore. For the excitation, a spectrophotometer is used to scan wavelengths by 1 nm increments and monitor the output of the fluorophore emission intensity at its emission maximum. Thus, the excitation is plotted as the percent efficiency of excitation to result in the brightness of the emission. The emission spectra is a scan of the emission range, normally from the wavelength of excitation in the direction of the longer wavelengths resulting from excitation at the excitation max of the fluorophore. Although both excitation and emission are read in arbitrary units of intensity, they are normally plotted on a spectra viewer scaled so that the highest intensity value equals 100% efficiency. Thus the y-axis of a spectra viewer is plotted as % Normalized Excitation/Emission.
Since the Aurora utilizes the full spectrophotometric profile of the fluorophores across all lasers to accurately unmix the fluorophores, the spectra of the Aurora is best seen as only the emission profiles collected in segments of 10-30nm across the emission range (longer than the excitation laser) off each laser. By looking at our Aurora Spectra Analyzer, you can see the nuances of the emission profile that will help make the fluorophore distinct from other neighboring fluorophores off the same laser, like Pacific Blue™ vs. BV421™ and APC vs Alexa Fluor® 647.
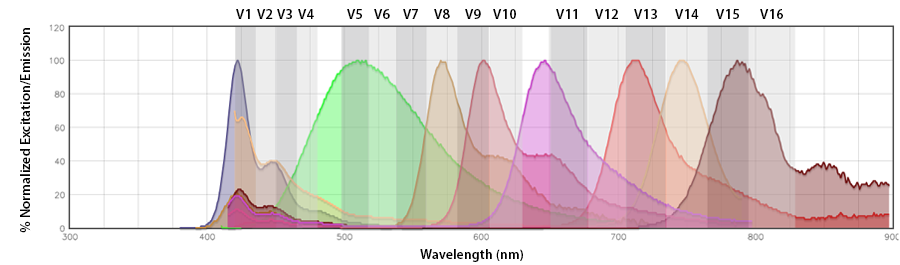
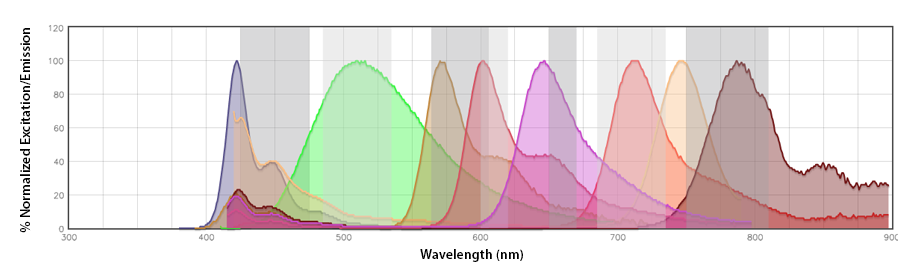
Spectral spillover: If the primary channel is considered the channel in the emission detection array where the fluorophore should emit with the highest efficiency (i.e., the channel that centers around its emission maximum), spectral spillover is the amount of photons from a fluorophore that emit into neighboring “non-primary” channels. For a traditional flow cytometer, Pacific Blue™ and BV421™, PerCP and PerCP/Cyanine5.5, Alexa Fluor® 647 and APC are prohibitive pairs, as are combinations of fluorophores that cannot be independently resolved from one another on a detection array with only the same number of photomultiplier tube (PMT) channels as there are fluorophores. In this instance, there is a discrete relationship between the fluorophore and its emission channel/PMT (Fig. 1b). The Aurora has end-on-end emission channel arrayed across the entire range of the emission (Fig. 1a). This would be a non-discrete relationship between the fluorophore and its intended emission channel. The Aurora depends on the contribution of all the fluorophores to these channels to collect enough spectral information to unmix each fluor from the other.
Intended channel: The photomultiplier tube behind the filter set of the channel that is supposed to receive the emission peak of that fluorophore.
Neighboring or spillover channel: The photomultiplier tubes behind the filter sets of the channels that neighbor the intended channel and into which other fluorophores might have spectral spilling.
Compensation is really a simpler way of unmixing spectral spillover. We apply compensation in order to re-assign the statistical identity of a fluorophore back to the fluorophore of origin. Compensation is not always required. It does not change data. It corrects for the position of a population on an axis in order to more easily gate and separate populations in a multicolor assay. There are a lot of factors that affect compensation values. It’s important to note that compensation is not the removal of one signal from a neighboring channel. It’s a correction factor applied to the ratio of fluorophores from the intended fluorophore into its intended channel from those non-intended fluorophores emitting into the intended channel. The number associated with a derived compensation value is primarily due to the degree of spectral spillover. However, spectral spillover does not equal compensation, they are not synonymous. The second largest contributor to compensation values is the voltage applied to the two PMT channels of the intended fluorophore and the spillover fluorophore. Compensation is also affected by laser power, PMT sensitivity, and tandem or reagent concerns.
Unmixing, on the other hand, is like an even more intricate form of compensation. For example, take a look at the violet laser images in the Concepts and Terms section. On a traditional instrument, compensation is between the single intended channel and the 6-7 other channels off the violet laser, With the addition of channels off the other lasers, there may be 18-22 channels at maximum. With the Aurora, the intended channel must be examined with 38-42 other channels. The sensitivity with which a spectrum can be reconstructed within the statistical distribution of photons across 38-42 channels is what people refer to as unmixing.
Thus the term spectral detection refers to the linear unmixing of a fluorescent spectrum across an array of emission detectors to statistically reassign the origin of a photon to the source fluorophore. It enables the use of multiple highly spectrally overlapping fluorophores in a single image or assay as long as the cardinal rules of panel design are also employed to ensure an optimal assay combination or panel. To learn more about spectral unmixing as a concept, learn more with
Nikon’s MicroscopyU webpage.
Panel building can be done successfully if you follow some of our cardinal rules for design. You can learn more with our
Multicolor Staining Guide. Otherwise, read through our pointers below.
1. Understand your instrument
- Know its particular specifications in terms of laser wavelengths.
- Are the lasers co-linear or spatially separated?
- Know the number of PMT detectors or emission channels.
- What filters are in front of each PMT detector or emission channel?
- Does your instrument have any limitations?
2. Understand your assay and biological model
- Choose correct clone and combination of antibodies for your biological question.
- Understand the range and variability of antigen abundance to expect.
- Use the correct controls.
- Identify other sources, like autofluorescence, of background in your assay or instrument.
- Be aware of donor-dependent differences including cell type distribution, autofluorescence and non-specific binding.
3. Understand your reagents
- Match fluorophores for your instrument.
- Match the brightness of a fluorophore to the abundance of antigens on the cell.
- Know the limitations of your reagents. For example, fixatives and photobleaching can affect brightness and compensation requirements for protein-based fluorescent tandems like PE/Cyanine5 or APC/Cyanine7.
4. Understand your controls
- Calibration controls tell you that your instrument is functioning accurately.
- Single color biological controls treated the same as your sample, tell you about autofluorescence and antibody performance. They are also useful for setting up and balancing voltages on traditional cytometers and serve as a useful back-up or test for the accuracy of the compensation control.
- Compensation controls are single color controls either on beads or cells to accurately compensate or unmix your multicolor stained sample.
- Isotype controls tell you if you have non-specific binding due to Fc receptor or fluorophores.
- FMO (fluorescence minus one controls) are the best controls for accurate gating in multicolor panels.
Where do errors in unmixing come from?
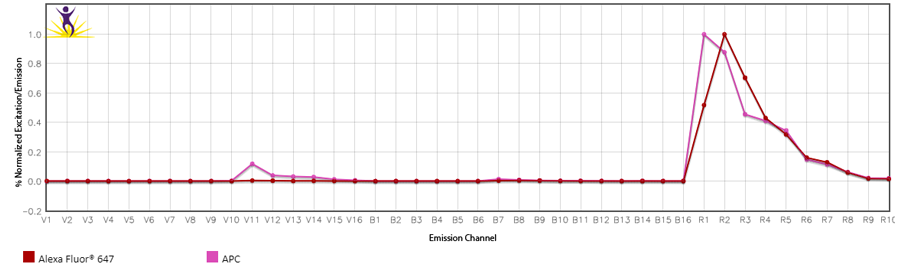
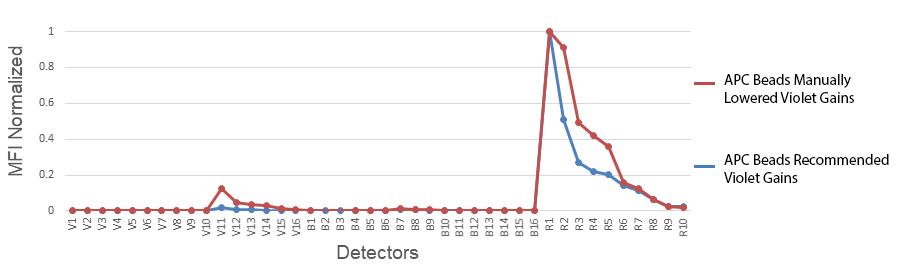
1. Changing the gains on the Aurora: Cytek has determined the optimal balance of gains off the violet laser. Although they may seem high, they have been specifically set for a reason. Fluorescent proteins like PE, APC and PerCP all have some violet laser excitation. Small organic fluorophores directly conjugated to antibodies, like the Alexa Fluor® dyes, Pacific Blue™, or FITC, etc. have relatively discreet excitation profiles and do not exhibit much cross-beam excitation by the violet laser. Historically, they were designed that way for microscopy applications where the sample is illuminated one laser at a time. Comparing the emission spectras of APC and Alexa Fluor® 647 are the best examples of these differences.
2. Not collecting enough events from the compensation control: The default has been set to 5000 gated events. We have found that in some instances, this is not enough, like when the fluor is very dim; the fluor emits into an area of high spectral spillover; or a single-color stained cell control is used, but the antigen is not abundantly expressed.
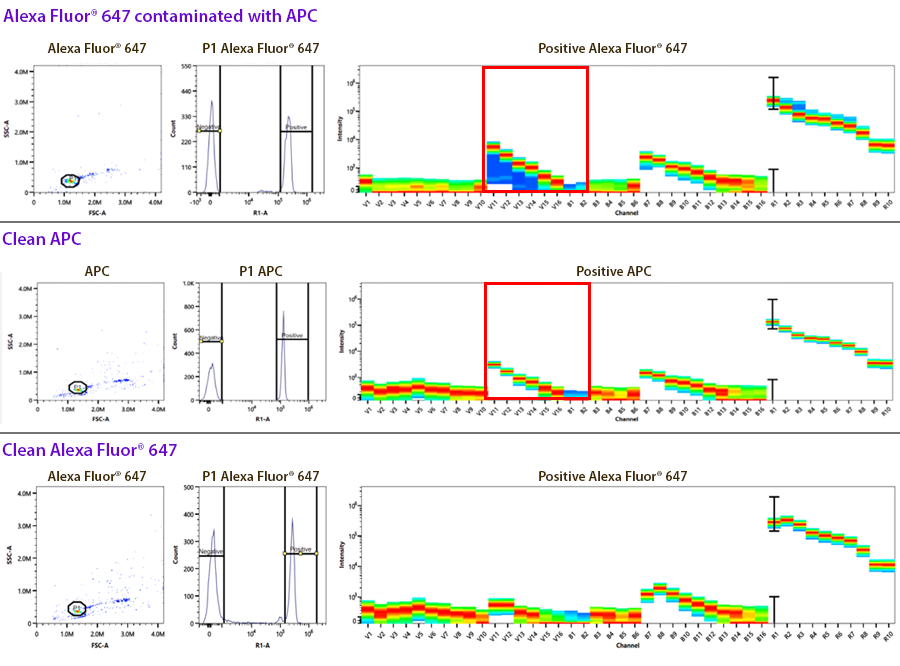
3. Contaminated controls: This is an example of identifying contamination of a control where they both emit into the same channel used for drawing the gates on the unmixing controls. Sometimes this contamination can look like two positive peaks on the histogram, where each peak when gated, exhibits a different spectrum. In this case, the compensation control was for Alexa Fluor® 647, but it was contaminated with APC (highlighted in the red box). Alexa Fluor® 647 doesn’t exhibit significant emission off the violet laser like APC does.
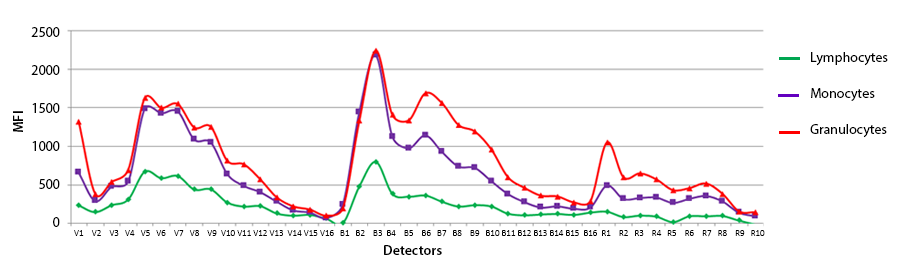
4. Autofluorescence: When applying compensation or unmixing to multicolor stained samples, the single color compensation controls assess the spectrum of the positive and the negative peaks. If only the same lot of beads are used as comp controls, you can choose to apply a “Universal Negative” spectral signature for all of the compensation controls. In this case, it’d be a vial of unstained comp beads. You could also do the same on cells. However, there is some slight variance of the autofluorescence of non-homogenous cell samples, like blood that contains monocytes, granulocytes and lymphocytes. Although the autofluorescent signatures of these different cell types is very similar, they are not identical. So, if you use cells as compensation controls and some antibodies are detecting antigens expressed on macrophages versus other markers on lymphocytes, you should not choose to utilize a universal negative, but rather draw gates on the histogram to represent the spectra from the positive and negative peaks. The plot below is not normalized but reflects the intensity difference into each of the channels on these different blood subsets.
In addition, another concern about autofluorescence is the use of an unstained cell sample to unmix the autofluorescence from your samples. Autofluorescence can change non-homogenously in a sample for a variety of reasons. This can impact the background in a fluorescent channel (especially the violet laser channels).
Autofluorescence is typically due to:
- Metabolic co-factors.
- Vitamins (e.g. B6 and B2), aromatic amino acids (e.g. tryptophan/ tyrosine), and polyphenols (e.g. retinol).
- Specific proteins like cellular adhesion molecules and collagen.
- Chromogenic cellular components like lipofuscin and melanin.
However, specific disease-related states or biological conditions of the experimental sample can contribute to variable degrees of autofluorescence that require controls that reflect this changing background.
- Therapeutic treatment like chemotherapy.
- The activation state of cells/higher metabolic activity.
- Addition of any chromogenic substrate or contrast agent.
- Tissues that filter toxins (liver), have a high metabolic rate (brain) or contain high levels of collagen (lung).
The conclusion isn’t that autofluorescence is bad, but rather, simply that it can create a variable in our data that needs to be controlled for in order to accurately use compensation and unmixing controls. This helps provide confidence that the positive populations we resolve in our data are true and reproducible.
Immunoprofiling Kit, 7 Color (Brilliant Violet™)
Contains 7 Brilliant Violet™ conjugated antibodies in individual vials, available for purchase from BioLegend. It can be used in conjunction with the 18-color immunoprofiling kit available from Cytek® Biosciences.
List of antibodies and conjugates provided in Immunoprofiling Kit, 7 Color (Brilliant Violet™):
| Antigen specificity |
| Anti-human CD197 (CCR7) |
| Anti-human IgM |
| Anti-human CD3 |
| Anti-human CD28 |
| Anti-human CD38 |
| Anti-human CD56 |
| Anti-human CD279 (PD-1) |
|
| Format |
| Brilliant Violet 421™ |
| Brilliant Violet 510™ |
| Brilliant Violet 570™ |
| Brilliant Violet 650™ |
| Brilliant Violet 711™ |
| Brilliant Violet 750™ |
| Brilliant Violet 785™ |
|
| Clone |
| G043H7 |
| MHM-88 |
| UCHT1 |
| CD28.2 |
| HIT2 |
| 5.1H11 |
| EH12.2H7 |
|
Ordering Information
Please contact us for ordering. Refer to the item information listed below when inquiring:
Product name: Immunoprofiling Kit, 7 Color (Brilliant Violet™)
Item number: 900004160
Technical Datasheet: 
Lead time for product delivery may vary. This information will be provided at the time of ordering.
These are the fluorophores we have validated with an Aurora instrument. Be sure to follow our multicolor staining guides during panel design for the best results. Build your panel by using our Panel Builder or e-mail our technical services group for more information.
| Ultraviolet 355 nm |
| Spark PLUS UV™ 395 |
| Spark UV™ 387 |
|
| Violet 405 nm |
| Brilliant Violet™ 421 |
| Pacific Blue™ |
| Spark Violet™ 423 |
| Spark Violet™ 500 |
| Brilliant Violet™ 510 |
| Spark Violet™ 538 |
| Brilliant Violet™ 570 |
| Brilliant Violet™ 605 |
| Brilliant Violet™ 650 |
| Brilliant Violet™ 711 |
| Brilliant Violet™ 750 |
| Brilliant Violet™ 785 |
|
| Blue 488 nm |
| Spark Blue™ 515 |
| KIRAVIA Blue 520™ |
| FITC or Alexa Fluor® 488 |
| Spark Blue™ 550 |
| Spark Blue™ 574 |
| PerCP/Cyanine5.5 |
| PerCP/Fire™ 780 |
| PerCP/Fire™ 806 |
|
| Yellow/Green 561 nm |
| PE |
| PE/Dazzle 594 |
| PE/Fire™ 640 |
| PE/Cyanine5 |
| PE/Fire™ 700 |
| PE/Fire™ 744 |
| Spark YG™ 581 |
| Spark YG™ 593 |
| PE/Cyanine7 |
| PE/Fire™ 810 |
|
| Red 633 nm |
| APC |
| Alexa Fluor® 647 |
| Spark NIR™ 685 |
| Spark Red™ 718 or Alexa Fluor® 700 |
| APC/Cyanine7 or APC/Fire™ 750 |
| APC/Fire™ 810 |
|
 Login / Register


Follow Us